Making Xdebug, Laravel Valet, PHPStorm, and Composer play nice
There are a handful of resources out there that explain how to set up Xdebug in PHPStorm, and maybe a couple on how to set it up in Valet. That’s great and all, but I’m sure you’ve also seen this:
You are running composer with xdebug enabled. This has a major impact on runtime performance. See https://getcomposer.org/xdebug
How annoying. But if you disable Xdebug, you can’t use it, obviously. Here’s how you can have the best of both worlds.
Disable Xdebug for the CLI
PHPStorm seems to still need Xdebug enabled when runs in Apache. Version 2016.2 says you can load it on demand, but I couldn’t figure that out. Meh, onwards.
If you’re using a relatively stock configuration, your php will be loading /usr/local/etc/php/7.0/php.ini.
Create a CLI version of php.ini
PHP will load the appropriate ini file suffixed with the SAPI, if it exists. Great, just make a copy of it to reference cli.
cp /usr/local/etc/php/7.0/php.ini /usr/local/etc/php/7.0/php-cli.ini
Ensure it only loads Xdebug from Apache
In addition to loading php.ini, it also loads all ini files in /usr/local/etc/php/7.0/conf.d/. There’s an ext-xdebug.ini
in there which is responsible for loading Xdebug. Since we only Xdebug in Apache, copy the contents of that and paste it
at the bottom of your /usr/local/etc/php/7.0/php.ini file (that’s the one Apache will use).
It should look something like this:
[xdebug]
zend_extension="/usr/local/opt/php70-xdebug/xdebug.so"
Then delete ext-xdebug.ini, or rename it to ext-xdebug.ini.bak if you’re a paranoid hoarder.
Enable Xdebug for Valet
Back in php.ini, add these right where you left off above:
xdebug.remote_enable=1
xdebug.remote_autostart=1
xdebug.remote_port=9001
By default the Xdebug port is 9000, but that’s what Valet runs on, so you’ll need something different.
How does 9001 sound? Perfect.
Restart PHP
At this point you’re done messing with PHP settings. To make them take effect, its simple:
valet restart
Confirm it worked
You can confirm it worked by running php -v and not see the Xdebug line at the end here:
$ php -v
PHP 7.0.7 (cli) (built: May 27 2016 11:13:44) ( NTS )
Copyright (c) 1997-2016 The PHP Group
Zend Engine v3.0.0, Copyright (c) 1998-2016 Zend Technologies
    with Xdebug v2.4.0, Copyright (c) 2002-2016, by Derick Rethans
For Apache, the easiest way is to drop a phpinfo(); at the top of an index.php in whatever project you can
switch to the fastest. Cmd+f and search for xdebug. If you get any results, hooray, it’s still enabled.
Lastly, run any composer command (composer about will do), and now you shouldn’t see the xdebug message.
Configure PHPStorm
- Open
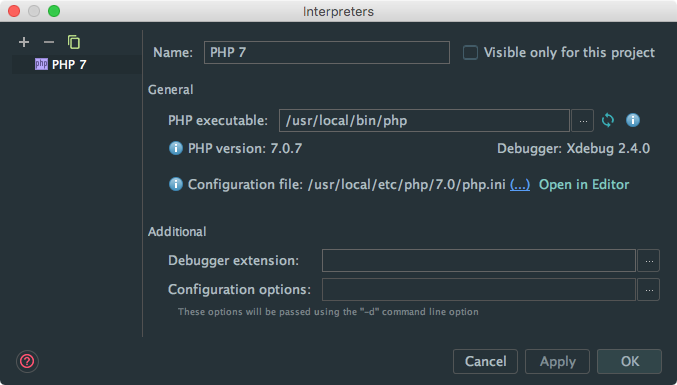
Preferences > Languages & Frameworks > PHP. - Next to the
Interpreterdropdown, hit the...button, and add a new one in the dialog that appears. - The executable should be
/usr/local/bin/php. - Hit the little refresh icon and all going well, it should say
Debugger: Xdebug. - Apply/OK out of there.
- Open to
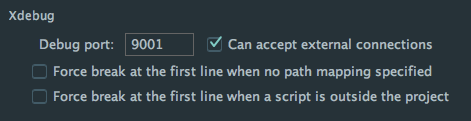
Preferences > Languages & Frameworks > PHP > Debug. - In the
Xdebugsection,Debug Portshould be9001(like you set inphp.iniearlier) - Uncheck both
Force break ...checkboxes.
If you don’t uncheck those checkboxes, the debugger will stop on Valet’s server.php every time.
Set up the app for debugging
At this point, Xdebug should be good to go. However if you haven’t Xdebugged before, you might be scratching your head about how to use the thing. I was too.
First, create a server that PHPStorm will use to whip open a debug session in the browser:
- Open
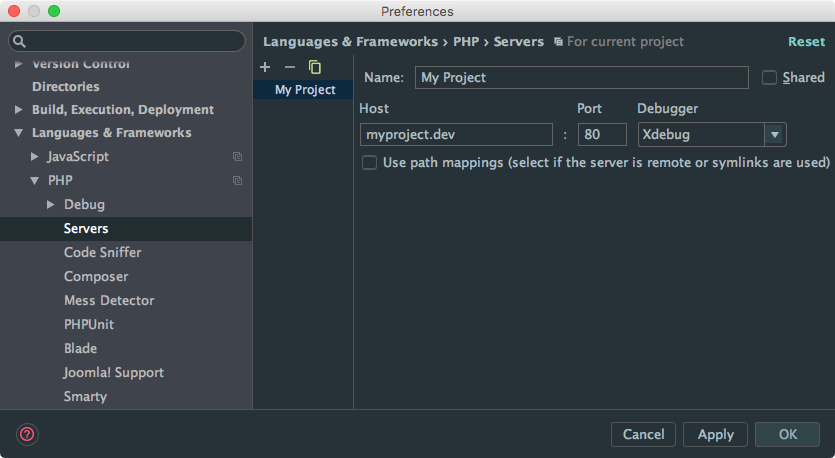
Preferences > Languages & Frameworks > PHP > Servers - Add a new server. Name it whatever. The name of your project is an idea.
- The host should be your dev domain, like:
myproject.dev - Port should be
80
Next, create a debug configuration:
- Open
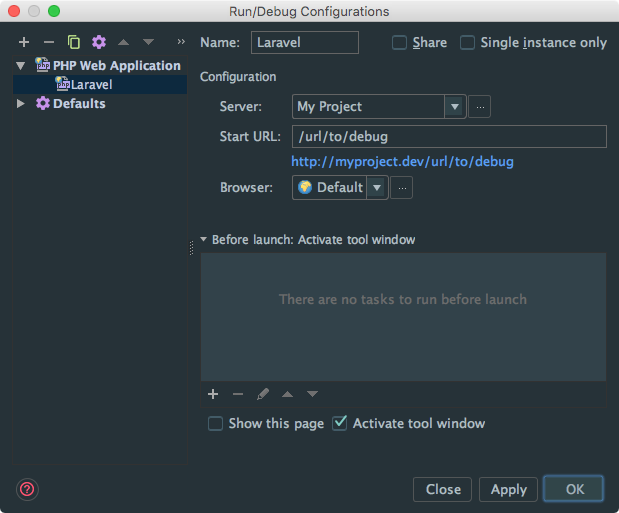
Run > Edit Configurations... - Add a new
PHP Web Applicationand name it whatever. - In the
Serverdropdown, select the server you just created. - The start URL should be whatever URL you want to run the debugger on.
Rinse and repeat for every URL you want to debug on. Or, just keep editing that configuration every time.
Run the debugger
Finally! What you can do now is go to Run > Debug... and choose the configuration you just created.
Or, Run > Debug 'Your Configuration', or Run > Debug 'Your Configuration', or the keyboard shortcut for it.
For me it’s ^D to run the latest debug configuration. Knowing PHPStorm, there’s probably 10 more ways to do it.
Remember to Debug instead of Run. Run will just… run the code.
Also, remember to set at least one breakpoint, or your debugging journey will end quite quickly. Just click in the left gutter of the line you want to break at.
Comments
blog comments powered by Disqus